


Document Actions
gvSIG-Desktop 1.9 Alpha. Manual de usuario.
The principal components analysis is a multispectral transformation that whose goal is to avoid the use of redounding information in image bands. This technique allows transforming a list of bands into new variables called interlinked variables, absorbing most of data variability in an initial bands subset.
To open the Principal Components tool, you have to use the remote sensing toolbar by selecting “Raster process” from the left button and “Multispectral transformation” from the right button.

The dialog window will appears as follow.
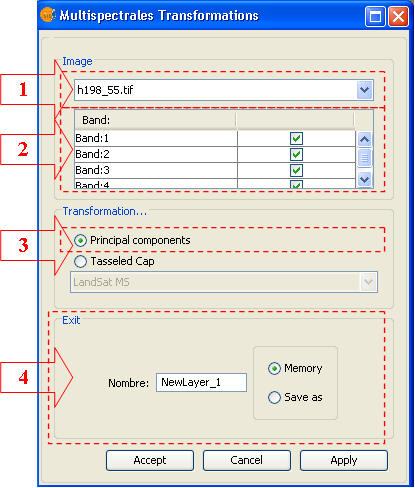
Step by step procedure to perform the transformation
- From the combo box, chose the image to which the transformation will be applied (1).
- Select the bands involved in the process in (2)
- Choose the Principal Components option. (3)
- Select output options. Select if you want to save the result as a file or to keep in Memory. In the first case you will be asked to specify the destination folder and the file name before launching the operation. If you choose to keep in memory, you will be able to save it later by the option “Save as” by clicking with the right mouse button over the corresponding layer in the TOC.
Start the process by Apply or Accept.
Later on, and during the analysis procedure, a dialog window similar to the one in the following figure will appear.
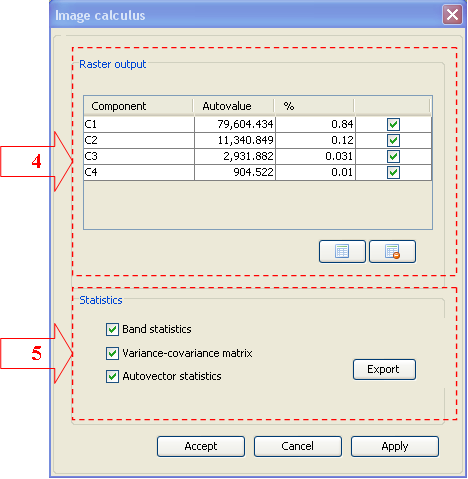
- Table fo components selection In this table you collect the information linked to every component calculated by the bands selected in the first window. The table include information of the corresponding autovalue and the percentage of variability absorbed by the component related to the total variability. The resulting image will be obtained according to the selected components
- Process statistics. The statistics generated in the previous procedure can be exported into a text file. To do this, every checkbox corresponding to the parameters must be selected, click on the option Export and select the path of the output file.
The image creation start by click on Apply or Accept. The result is a float image with as many bands as the selected components and it will automatically load in the view as the process finishes.


